
Aleksandr Pekarsky
Founder, Chief Visualization Officer, CEO
fun fact #1
fun fact #2
Aleksandr Pekarsky is the founder of Brightalytics LLC. His diverse consulting and entrepreneurial experience allows him to communicate and work effectively with company founders and leaders across functions.
His approach at Brightalytics is to clarify client's challenges and objectives and then work on eliminating the gaps by designing and building visual data analytics solutions to continuously capture, analyze, and monitor business signals. In addition, he deconstructs businesses and their processes and uses Tableau visualizations to identify drivers contributing to profits or draining resources.

At the San Francisco Bay Area Tableau Hackathon.
- Sony
- Capital One
- Macy’s
- DuPont
- MediaCom
- ZenithOptimedia
- Neo@Ogilvy
- Academy of Art University
- Cathay Pacific
- RAPP
- Razorfish
- Starcom MediaVest Group
- USMC
Aleksandr's Tableau journey started when he met with a Shark Tank show contestant who had an idea for a Fintech startup and wanted to visualize consumer spending, bills and investment objectives. By that time, Aleksandr has already been working with financial, marketing and operational reports for more than a decade and got instantly captivated by the power of Tableau.
Few years earlier, he realized the power of visualizing data while working as an Assistant Vice President at JPMorgan Chase. He introduced a graphic summary of survey results on the cover of Chase Poll reports, which highlighted both the challenges as well as achievements based on both qualitative and quantitative measures. Later, while supporting credit card insurance product, he used charts to analyze effectiveness of customer acquisition across multiple marketing channels, attrition patterns, and revenue trends.

Working on the new JPMorgan Chase Poll design with a survey summary chart on the cover.
One of the memorable moments for Aleksandr was presenting stock research in the glass office on the roof in New York while Trump helicopters were periodically landing by the Hudson River. Aleksandr color coded the investment reports indicating positive or negative investment signals. Another example of visual analytics in action!
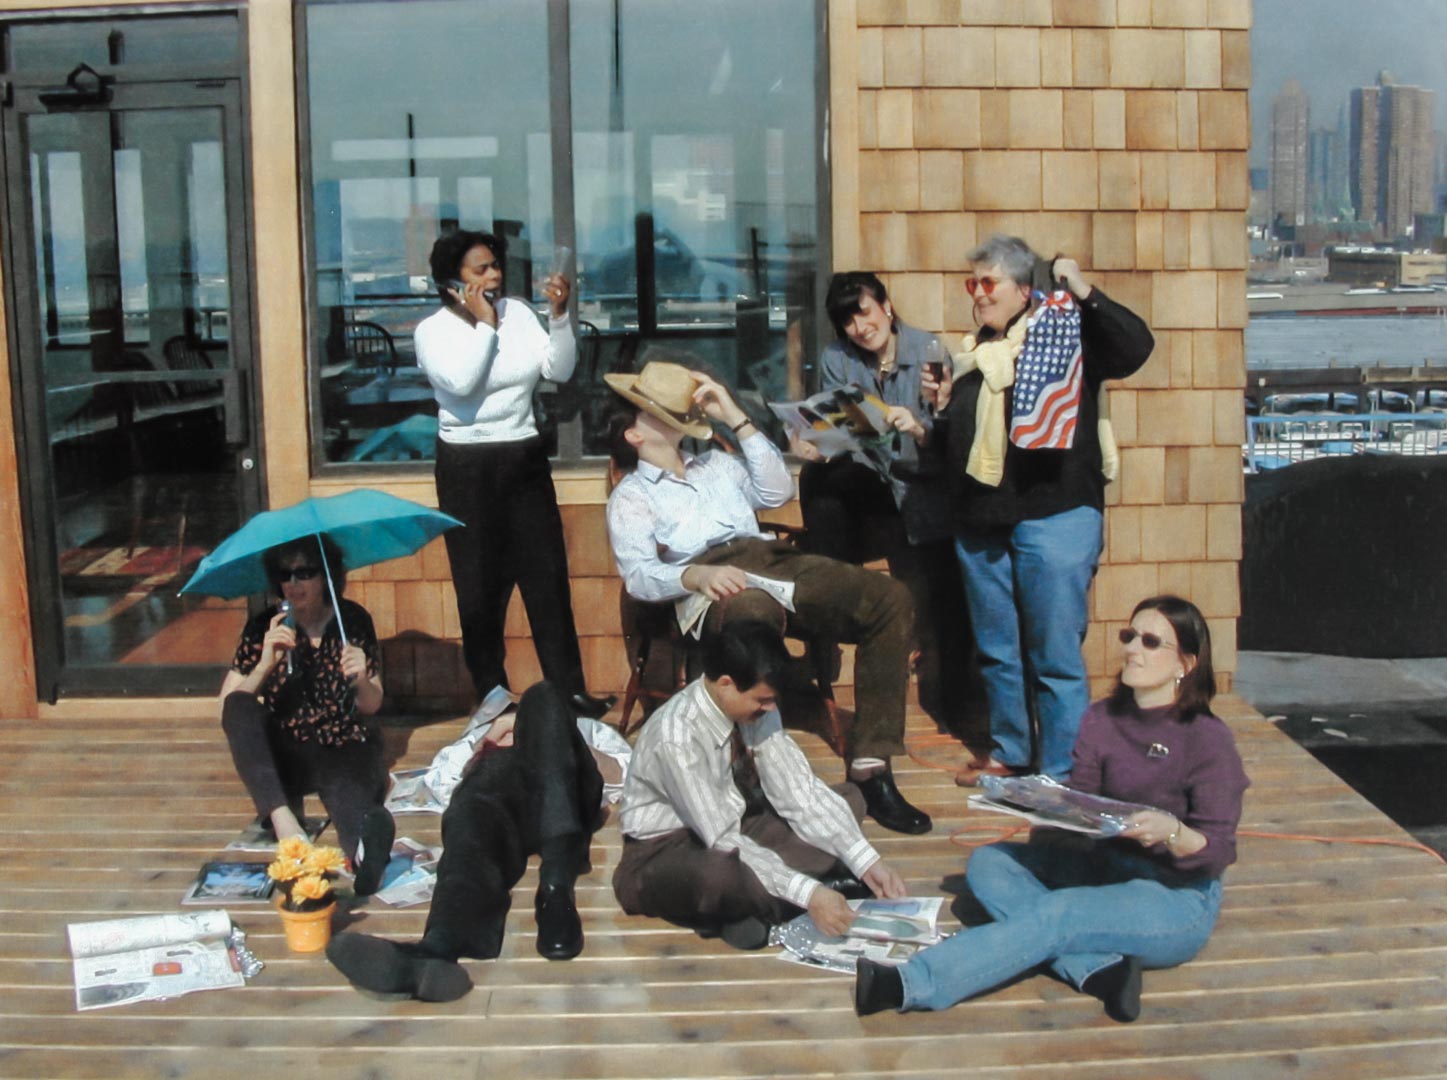
Having fun on the roof of the NYC building while the bosses are out.
Aleksandr received an MBA degree in Finance and International Business and BBA in Marketing from Texas Tech University. He participated in Aalto University (former Helsinki School of Economics) MBA exchange program. In addition, he studied management in civil engineering and completed several professional certification programs, including banking, databases, web and desktop applications.
His interests include videography, photography, international travel, paddle boarding, exotic foods, fitness, Star Trek, and spending time with his family. Aleksandr's world view has been enriched by cultural experiences of living in Finland, Iraq, US, Russia, Ukraine, and Taiwan.